In the past few weeks I have been engaging in a project my professors call “Dear Rome Data.” Each week there is a new theme to guide data collection around the city. After the data collection period, I put together a graphic and attached data summary to convey what I had discovered.
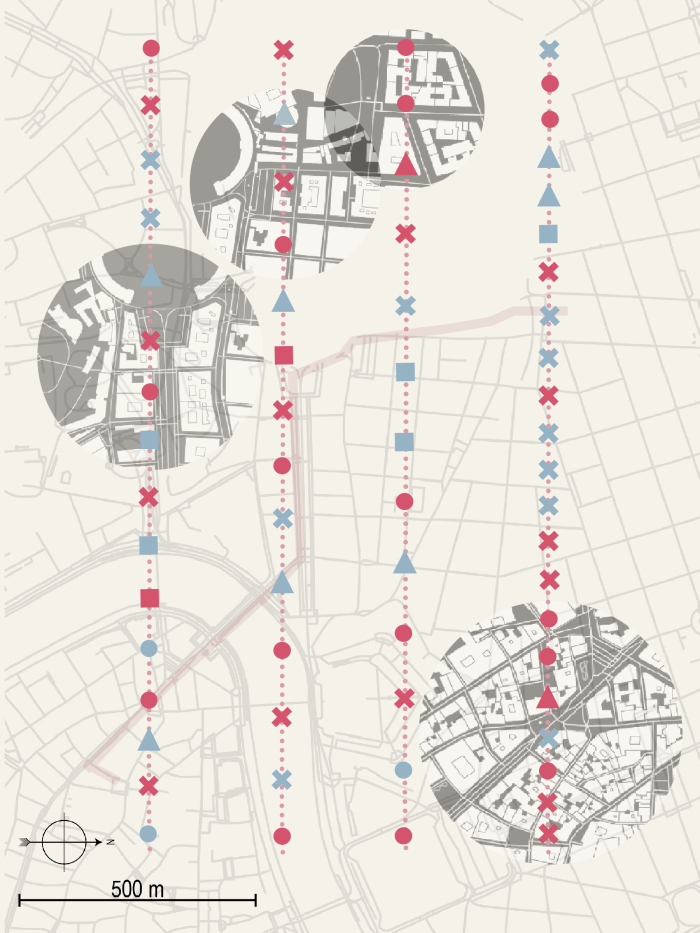
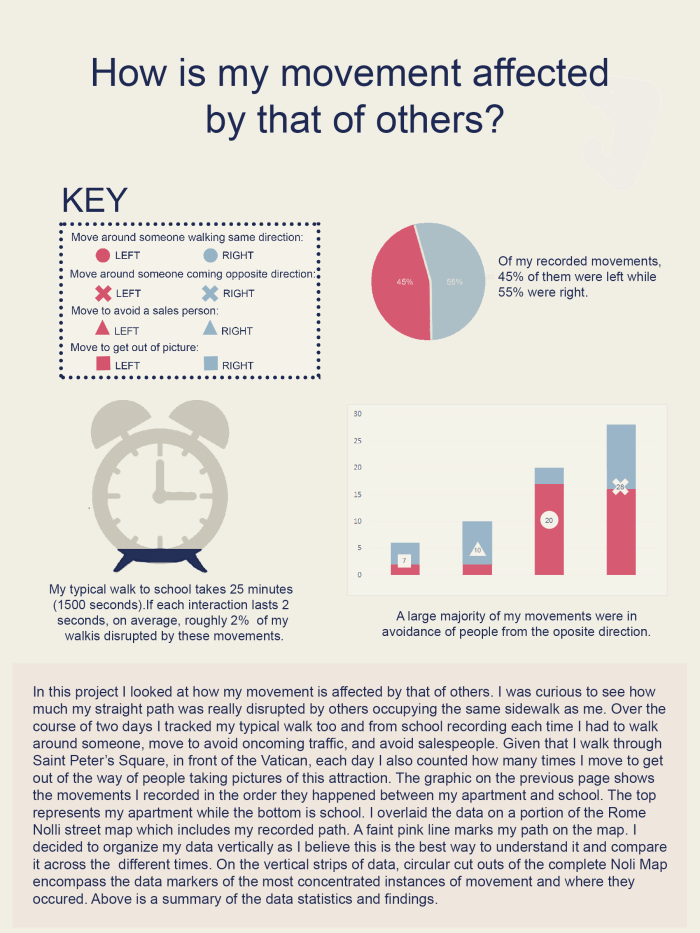
Week 1: Mapping movement
How is my movement affected by that of others on the sidewalk?
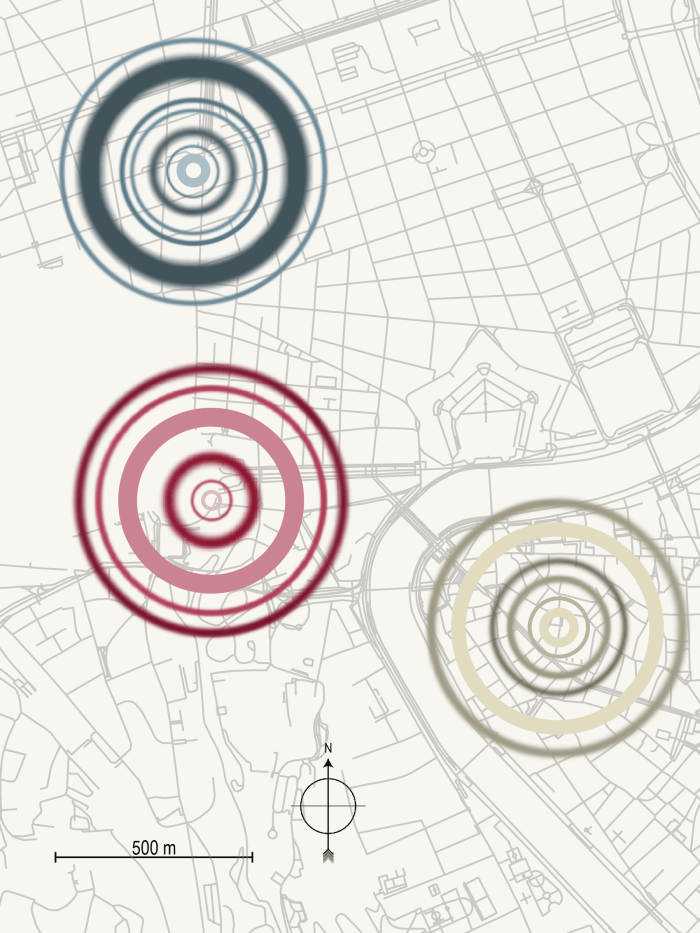
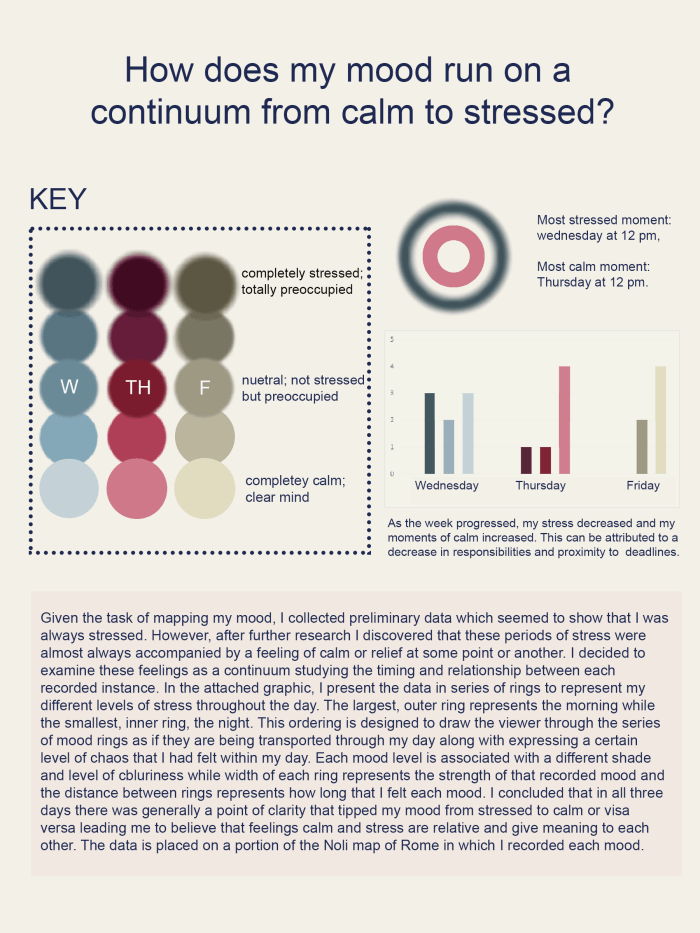
Week 2: Mapping and Mood
How does my mood run on a continuum from calm to stressed?